Performance Monitoring
Performance monitoring means tracking how fast, stable, and responsive a website feels to real users.
It helps us understand:
- how fast the page loads
- when users can interact
- whether the layout is stable
- where the app feels slow or broken
Performance Monitoring = Measuring user experience using performance metrics.
Instead of guessing performance problems, we track real signals.
One-line idea: Performance Monitoring = Tracking loading speed, visual stability, and interaction responsiveness.
Core Concepts
Core Web Vitals
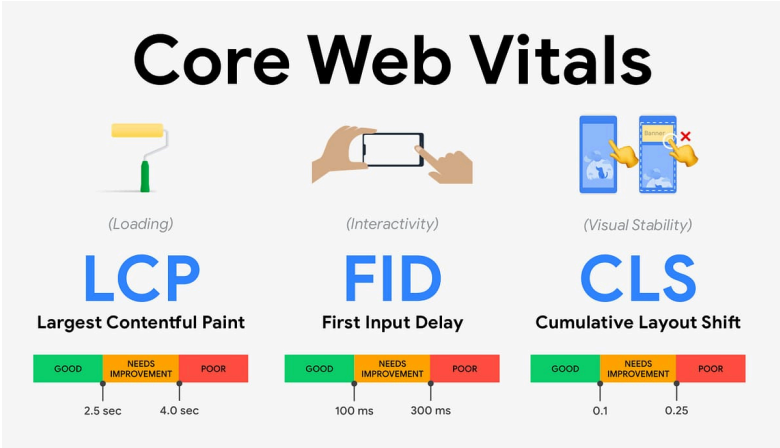
Core Web Vitals are key metrics used to measure real user experience on a website.
They focus on three main areas:
Loading Speed
Interactivity
Visual Stability
Main metrics:
- FCP
- LCP
- CLS
- FID
- INP
Core Web Vitals: FCP
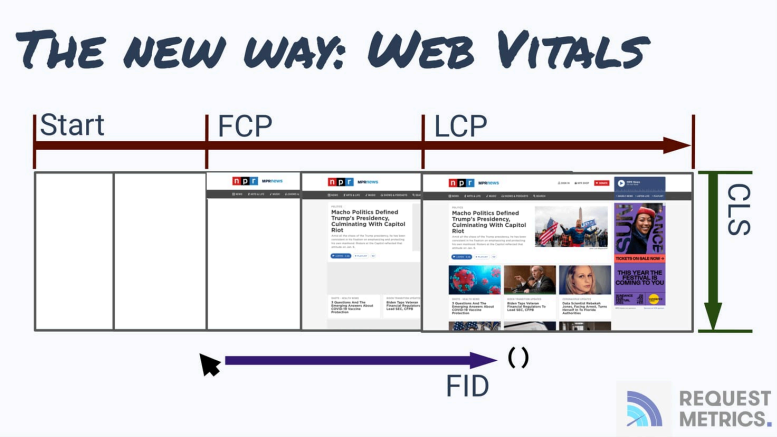
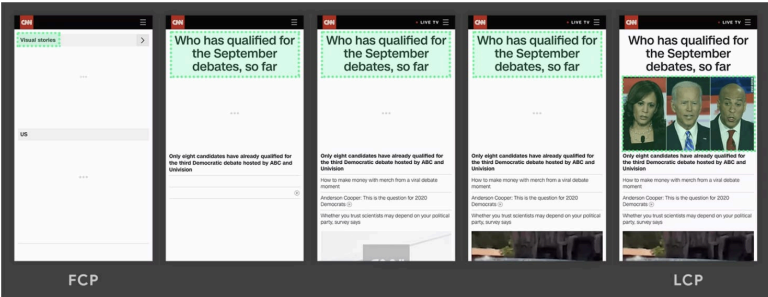
FCP stands for First Contentful Paint.
It measures the time from when the page starts loading to when the first visible content appears on the screen.
That content can be:
- text
- image
- logo
- any visual element
Simple meaning:
FCP = When the user stops seeing a blank screen.
Example:
A heading or logo appears after 1-2 seconds.
Core Web Vitals: LCP
LCP stands for Largest Contentful Paint.
It measures how long it takes for the largest visible element to fully render on the screen.
This can be:
- hero image
- banner
- main content block
- product image
Simple meaning:
LCP = When the main content becomes visible.
Example:
Main banner loads within 2.5 seconds -> page feels fast.
Core Web Vitals: CLS
CLS stands for Cumulative Layout Shift.
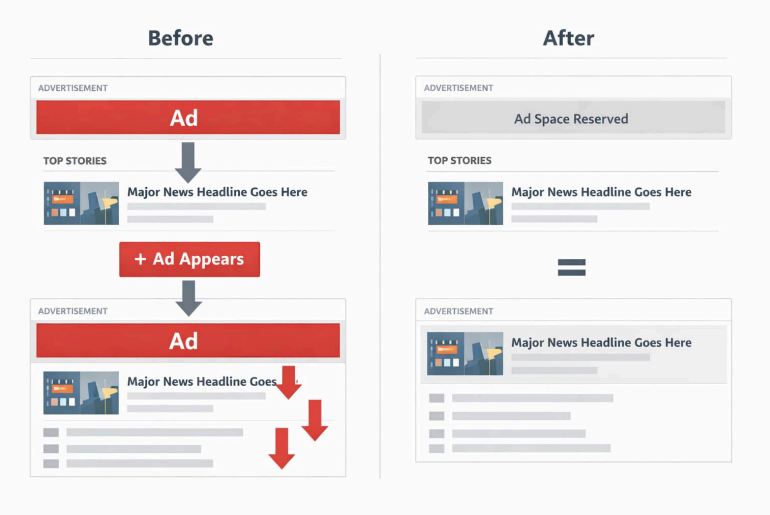
It measures how much page elements unexpectedly move while loading.
CLS is about visual stability.
Simple meaning:
CLS = Does the page layout move unexpectedly?
Example:
A button moves down after an image loads late,
and the user clicks the wrong thing.
High CLS creates a bad user experience because users may lose their reading position or misclick.
Core Web Vitals: FID
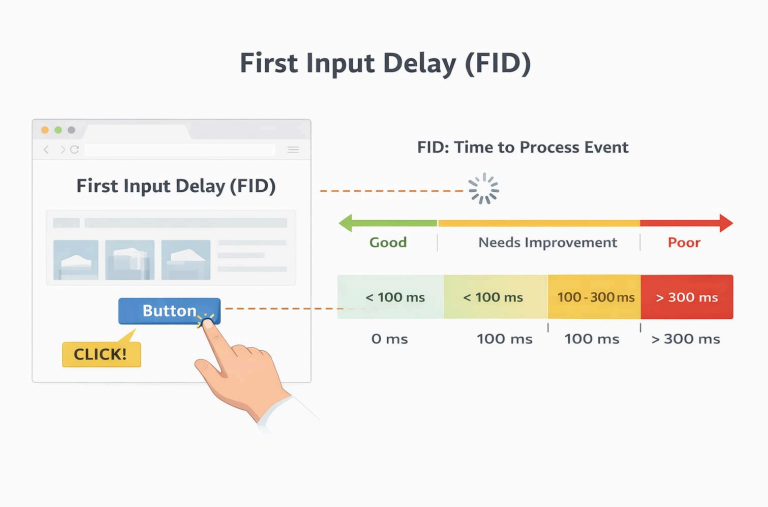
FID stands for First Input Delay.
It measures the delay between the user's first interaction and when the browser can start processing it.
User interaction can be:
- click
- tap
- key press
Simple meaning:
FID = Delay before browser responds to the first user action.
Example:
User clicks "Buy Now",
but the browser is busy running JavaScript,
so the response feels delayed.
FID usually becomes high when the main thread is busy.
Core Web Vitals: INP
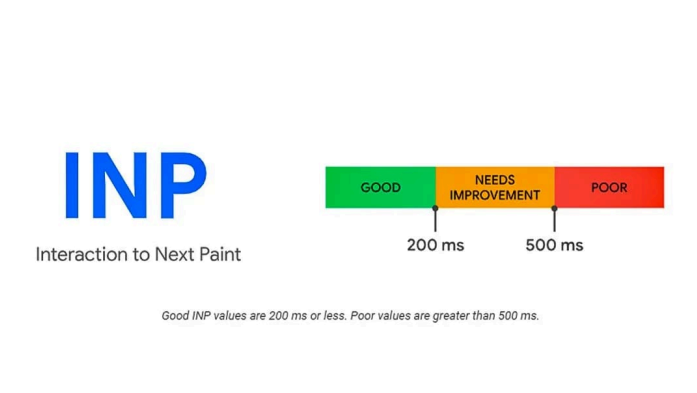
INP stands for Interaction to Next Paint.
It measures the time from user interaction to the next visual update on the screen.
It includes:
- input delay
- processing time
- rendering time
Simple meaning:
INP = How fast the UI visually responds after interaction.
Example:
User clicks a button to open a modal,
but the modal appears late due to heavy processing.
INP gives a more complete picture of responsiveness than FID because it looks at real interactions during usage.
Practical Examples
Metrics Quick Table
| Metric | Full Form | What It Measures |
|---|---|---|
| FCP | First Contentful Paint | First visible content |
| LCP | Largest Contentful Paint | Main content load speed |
| CLS | Cumulative Layout Shift | Visual stability |
| FID | First Input Delay | First interaction delay |
| INP | Interaction to Next Paint | Interaction responsiveness |
FCP = First thing appears
LCP = Main thing appears
CLS = Page should not jump
FID = First action should respond
INP = Every interaction should feel fast
Browser-Centric vs User-Centric Metrics
Performance metrics can be understood in two ways:
- Browser-centric metrics
- User-centric metrics
Browser-Centric vs User-Centric Metrics: Browser-Centric Metrics
Browser-centric metrics focus on technical loading and rendering behavior.
They are useful for:
- debugging
- finding bottlenecks
- code-level optimization
Examples:
- TTFB
- DOMContentLoaded
- Load Time
Tools:
- Chrome DevTools
- Lighthouse lab mode
Browser-Centric vs User-Centric Metrics: User-Centric Metrics
User-centric metrics focus on actual user experience and perception.
They are useful for:
- improving satisfaction
- prioritizing UX
- measuring business impact
Examples:
- LCP
- CLS
- FID
- INP
Tools:
- Chrome UX Report
- Analytics
- RUM tools
Comparison Table
| Topic | Browser-Centric | User-Centric |
|---|---|---|
| Focus | Technical loading/rendering | Real user experience |
| Data Type | Lab data | Field data |
| Use | Debugging and optimization | UX and business impact |
| Examples | TTFB, DOMContentLoaded, Load Time | LCP, CLS, FID, INP |
| Tools | DevTools, Lighthouse | Chrome UX Report, Analytics, RUM tools |
Summary
Performance Monitoring = Tracking loading speed, visual stability, and interaction responsiveness.
Can user see content?     -> FCP / LCP
Does layout stay stable?  -> CLS
Can user interact fast?   -> FID / INP